
Which 2024 demographic vote gap [Race/Age/Education/Gender/etc.] will increase when compared to 2020?

Plus
16
Ṁ499Jan 1
1D
1W
1M
ALL
70%
Education (college graudate+ vs no college degree) [32 Democrat]
64%
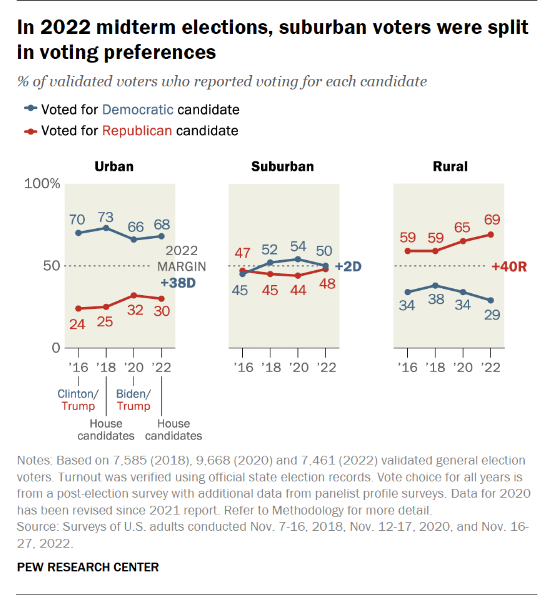
Urban vs Rural [65 Democrat]
62%
Gender (women vs. men) [13 Democrat]
47%
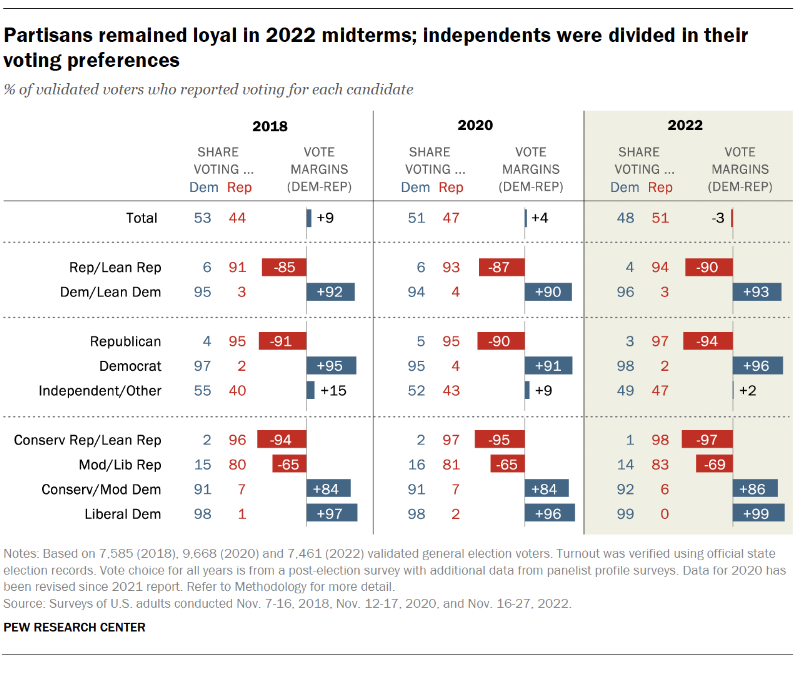
Partisan (Democrat vs Republican identification) [181 Democrat]
36%
Race - Black vs White [96 Democrat]
35%
Race - Hispanic vs White [37 Democrat]
29%
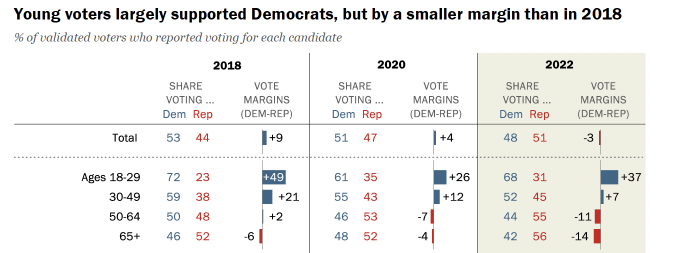
Age (18-29 vs 65+) [30 Democrat]
Pew Research surveys validated voters after national elections and asked them about their demographics and vote. Here are the results after the 2022 midterms:


You can also see the results for the 2016 election here.
This market will resolve based on Pew's findings after the 2024 election, by comparing the change in vote % from 2020. the square brackets show the gap in 2020
Any option where the gap in percentage points of vote margins is larger than that of 2020 will resolve YES. All others will resolve NO. Ties will resolve NO, even if more granular data is available. This means that the difference must be 1% when rounded.
Credit to @Joshua for the inspiration. See
Get Ṁ1,000 play money
Related questions
Related questions
Will voter participation in the US be higher in 2024 than 2020?
2% chance
Which 2024 demographic [Race/Age/Education/Gender] will vote most Democratic when compared to 2022?
Which 2024 demographic [Race/Age/Education/Gender] will vote most Republican when compared to 2022?
Will any demographic [Race/Age/Education/Gender] shift by 20 points or more in the 2024 US presidential election?
75% chance
Will the 2024 election have a young person voter turn out that surpasses that of the same turnout in the 2020 election?
65% chance
Will the 2040 electoral map differ from 2020 more than 2020 differed from 2000?
68% chance
Will the U.S. be more democratic in 2024 than it was in 2022?
25% chance
Will the Democratic party receive a greater vote share in the 2024 Presidential election in Macomb, MI versus 2020?
3% chance
Will the Asian voter turnout in the 2024 Presidential election be 60% or larger?
59% chance
How will high propensity voters vote in the 2024 Presidential Election relative to low propensity voters?