Data is currently at
https://data.giss.nasa.gov/gistemp/tabledata_v4/GLB.Ts+dSST.csv
or
https://data.giss.nasa.gov/gistemp/tabledata_v4/GLB.Ts+dSST.txt
(or such updated location for this Gistemp v4 LOTI data)
January 2024 might show as 124 in hundredths of a degree C, this is +1.24C above the 1951-1980 base period. If it shows as 1.22 then it is in degrees i.e. 1.22C. Same logic/interpretation as this will be applied.
If the version or base period changes then I will consult with traders over what is best way for any such change to have least effect on betting positions or consider N/A if it is unclear what the sensible least effect resolution should be.
Numbers expected to be displayed to hundredth of a degree. The extra digit used here is to ensure understanding that +1.20C resolves to an exceed 1.195C option.
Resolves per first update seen by me or posted as long, as there is no reason to think data shown is in error. If there is reason to think there may be an error then resolution will be delayed at least 24 hours. Minor later update should not cause a need to re-resolve.
@gonnarekt Yeah, just by virtue of July's value being somewhere near 1.0 C means the next month's value won't likely be too far, but if you look at the first order differences for LOTI alone, a 0.1 C span for your 0.95-1.05 C range corresponds to merely the 34 percentile. Not enough to go on IMO:
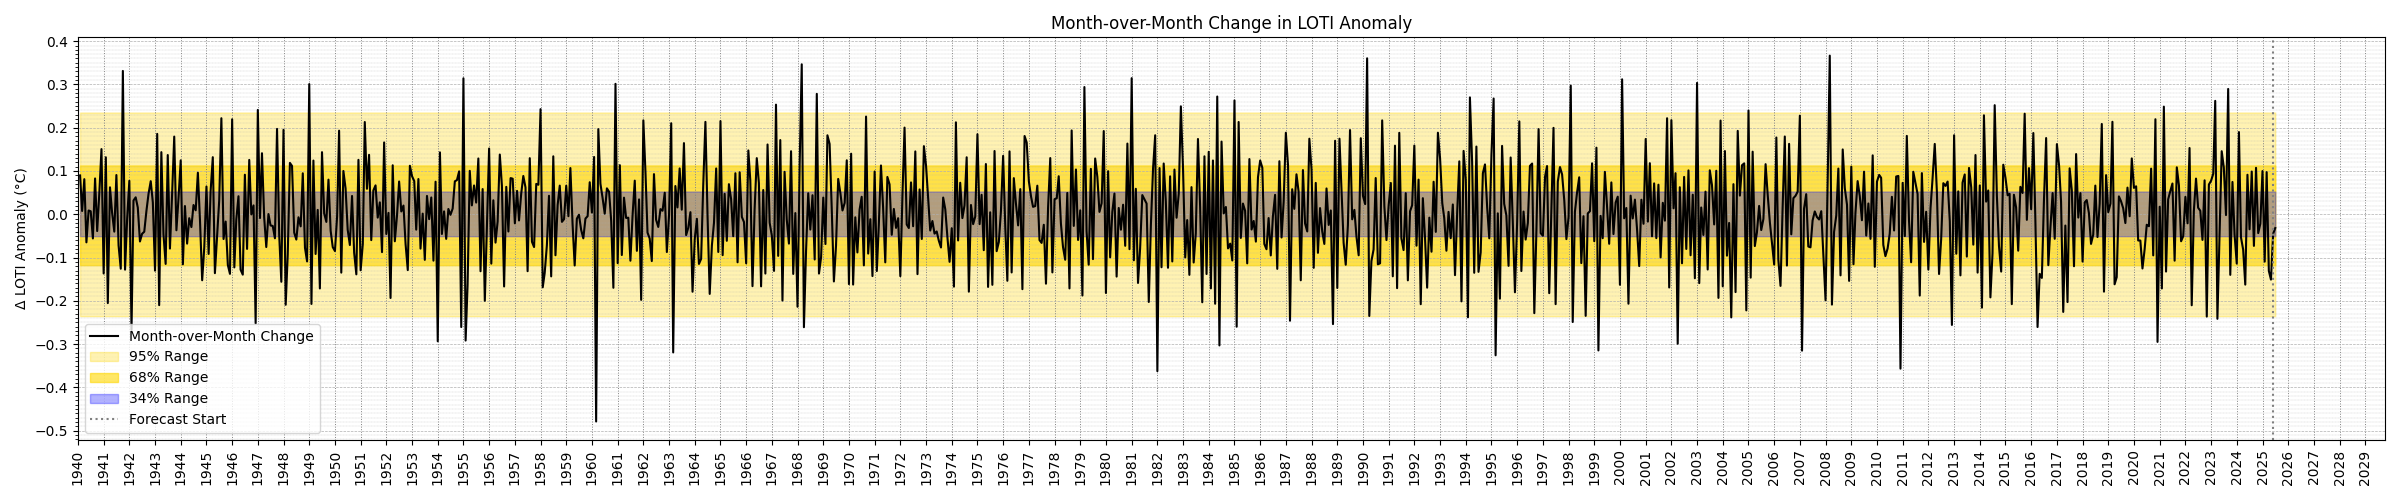
Some big outliers though as you can see...
Edit: random tidbit:
The biggest one month change after 1940, happened in ENSO neutral conditions, in March 1960. Notably, there was record breaking cold temps over much of the Eastern U.S.:
https://en.wikipedia.org/wiki/March_1960_nor%27easter
"The departures this March were more than 2 standard deviations over a large area of eastern United States, roughly corresponding to the region where record temperatures for March occurred, and greater than 3 standard deviations for a sizable region in central United States."