Invalid contract
Resolution source will be the JSON from VISHOP https://ads.nipr.ac.jp/vishop/#/extent from which I will compute the mean for March 2026 when the entire month's data comes in.
In the very unlikely event that it ends up exactly on a bin edge (i.e. 14.0000000), the bin edges will be interpreted as [low, high).
Question will resolve once March 2025 data from VISHOP becomes available.
If data is still unavailable by end of April I will consider N/A'ing the market. I'll leave the market open.
At the moment this market closes on April 15, as an arbitrary cutoff date to keep it open while data is outstanding, but will likely resolve earlier as the data should arrive well before then.
@ChristopherRandles I was surprised by your initial predictions being on the high end and ended up browsing data…
I only had a vague guess that it would be on the low end based on looking at some simple statistical calculations and the recent anomalies i mentioned on the gistemp market, but looking at a similar webpage that references a different dataset, some simple statistical indicators to date would seem to indicate we might be headed towards even a record low…
https://forum.arctic-sea-ice.net/index.php/topic,4329.msg434830.html#msg43483
At the very least the area sea ice extent matched my expectations from seeing the anomalies from gistemp (https://forum.arctic-sea-ice.net/index.php/topic,4329.msg434711.html#msg434711)
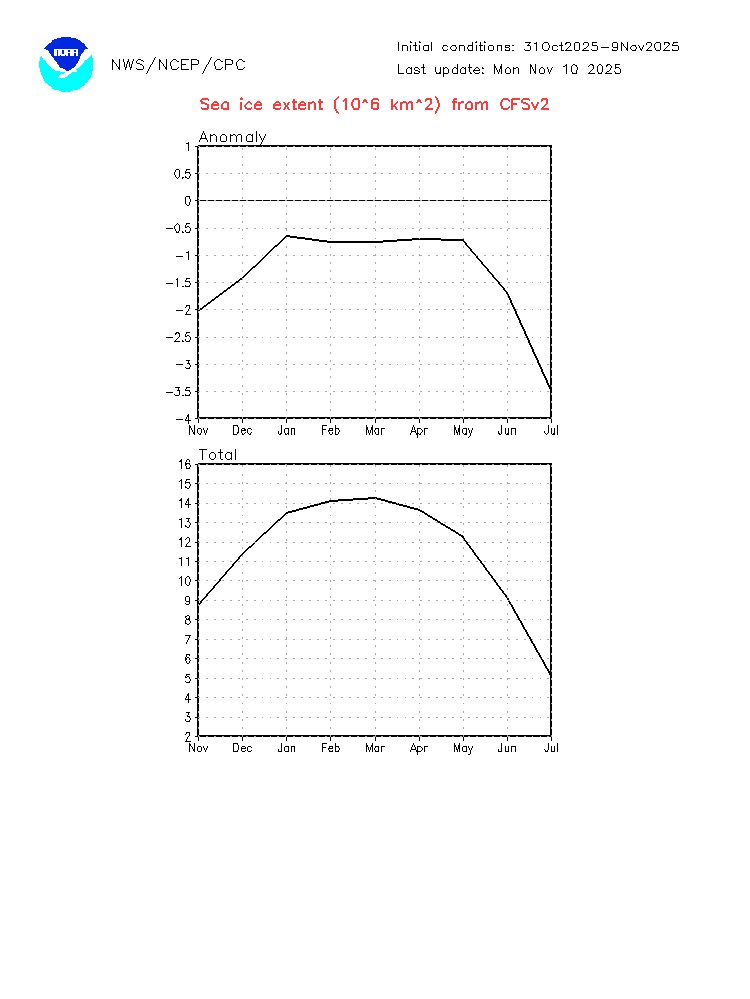
I looked at CFS (https://www.cpc.ncep.noaa.gov/products/CFSv2/CFSv2seasonal.shtml and it shows more towards the high end but accounting for some cold winter bias which it is known to have and examining the last few years of Nov init SIE predictions, not the highest bin (the bias by eye between the two datasets looks to be roughly in the +0.2 to +0.3 range compared to vishop from a quick glance), which would put the mean in the third or second highest bin? This was a bit surprising also…
I glanced at the NMME products also to figure out what’s going on
Aside from some below average temps north of the east Siberian sea… (because elsewhere it still looks like quite anomalous temps)

I can only speculate that perhaps above average precipitation in Dec and March will bring it up? I don’t know 🤷


@parhizj There is strong reversion to the trend. If there is low ice extent as winter approaches then there is lots of water that gives off heat easily whereas ice insulates the warm water so much less heat loss. The ice formation depends on the amount of heat loss.
Above is pretty solidly based on thermodynamics physics and the data shows it.
What is much less clear is whether after a year with a strong downward movement, do you tend to get a rebound the next year? Graph probably suggests no (1 yes 2 no?) and I may have overdone my expectation for a relatively high level this year.
An upward trend since 2015 I would suspect is spurious. On the other hand, there was a period 2002-2012ish where the arctic changed to much thinner less multiyear ice on the Russian side. Once that thick and MYI was gone, the thinner remaining ice melts out each year, and new slower trends have been apparent since then. So a latest trend line might plausibly be only getting down to about 13.9 rather than the ~13.7 if I used a straight line through March data from 2008.

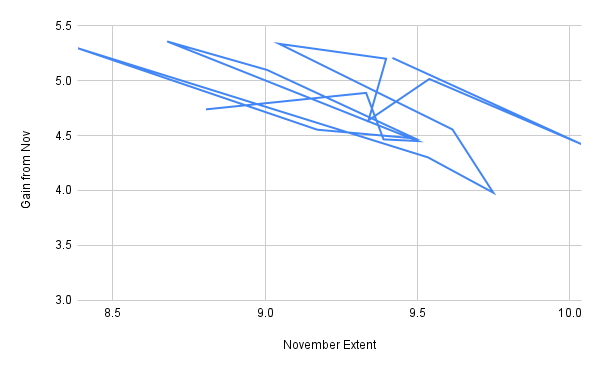
The data for above graphs
Year, March, Prev Nov, Gain from Nov
2008-03-01 14.62376506 9.418130429 5.205634636
2009-03-01 14.45991381 10.0384542 4.421459606
2010-03-01 14.55340665 9.539251367 5.014155278
2011-03-01 13.97838974 9.339794233 4.638595509
2012-03-01 14.59582716 9.3974318 5.198395361
2013-03-01 14.38029497 9.046578 5.333716968
2014-03-01 14.17024394 9.615223233 4.555020702
2015-03-01 13.72900245 9.7491209 3.979881552
2016-03-01 13.83592787 9.5349185 4.301009371
2017-03-01 13.67942894 8.384798967 5.294629969
2018-03-01 13.72431094 9.1714044 4.552906535
2019-03-01 13.96533181 9.492540759 4.472791048
2020-03-01 14.10312587 9.006902233 5.096223638
2021-03-01 14.03425487 8.678768433 5.355486438
2022-03-01 13.95167955 9.5020577 4.449621848
2023-03-01 13.85361284 9.388955833 4.464657005
2024-03-01 14.21931497 9.331787833 4.887527134
2025-03-01 13.54402413 8.8062687 4.737755429
@parhizj Precipitation adds snow to ice already formed increasing insulation and reducing ice formation though this is more about thickening of ice already present than ice formation. Snow or rain on water doesn't form ice, while solid ice pellets might sound the right state to be helpful for ice formation, I would suspect that mixing of the water might be more of a hindrance to ice formation in at least some conditions. Further the clouds needed to produce precipitation also insulates and reduces outgoing radiation so less ice formation.
@ChristopherRandles thanks for notes…
I skimmed the arctic-rcc (which just got designated by the wmo last year) presentation slides (that happened last week) and their outlook (with the last 9 years reference period) is very coarse but it appears they are roughly predicting the same categorically below normal sea ice for winter 2026 as 2025 albeit with lower confidence, although it appears to be based on forecasts from a bit earlier on (early October at the latest).
So given the vishop data has the March mean for the last 9 years as 13.897 (if I did that correctly) then it would seem they are predicting it should be below this.
They don’t have a statement released yet but it should come out soon given that their conference was last week. The presentation is below that has their outlook on page 115
https://arctic-rcc.org/sites/arctic-prcc/files/2025-11/ACF16_presentations_day_2.pdf#page115
~
Page 42 also has a sea ice concentration chart, and the slide notes the quasi cycles of 2-6 years and it does look like it should bounce back up, but will it be this year as part of the trend?

@parhizj
That is better forecast than trusting me, and I have reduced my holdings.
Also
https://climate.rutgers.edu/snowcover/chart_daily.php?ui_year=2024&ui_day=314&ui_set=2
and
https://climate.rutgers.edu/snowcover/chart_daily.php?ui_year=2025&ui_day=314&ui_set=2
are perhaps a bit similar probably worse particularly re Northern Europe and maybe that area is big enough to persist.
Maybe I should reverse holdings rather than just reduce them.
@ChristopherRandles plenty of time to update at least in the months to come based on other models
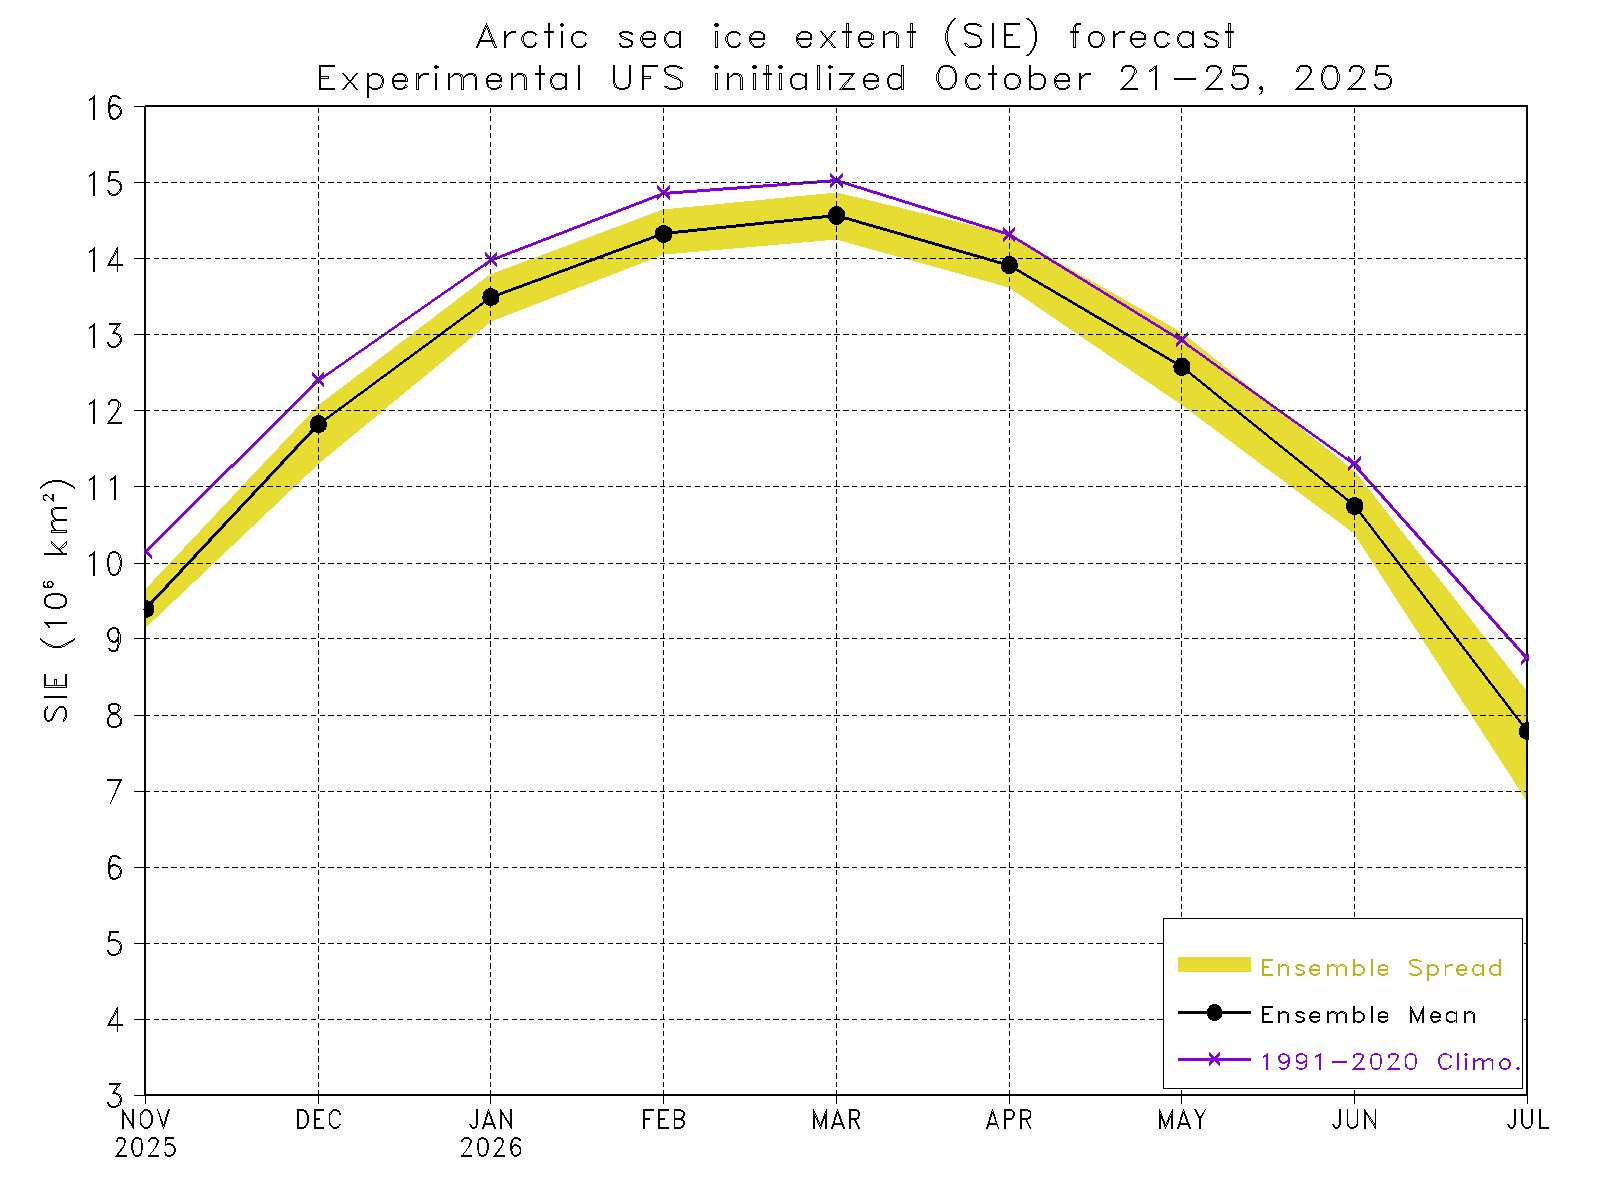
I found the experimental UFS/NOAA model I believe that the slide deck i showed you referenced below:
https://www.cpc.ncep.noaa.gov/products/people/jszhu/seaice_seasonal/index.html
Should be superior to cfs per the paper mentioned on the page (skimmed it)
No product for the Canadian yet afaik.
Also has the archive of the netcdf files as far as I can tell, so you should be able to be a bit more accurate than eyeballing it, but just visually alone their 1991-2020 reference period is about 15-14.465 ~= 0.535 above the vishop mean for March for the same reference period, which eyeballing the chart below is between 14.5 and 14.6, so adjusting for the difference in datasets would bring it down to roughly 14.0, which was basically also my guess from visually adjusting down from CFS (from what I took as the bias visually from looking at the last few years… i.e. 14.2-0.2=14 was my guess last night)